
Second of three. A series on London’s borough disparity in approving small housing schemes: the measure, its cost, and who bears it.
Two developers spend the same £60,000 on the same things: the drawings, the consultants, the surveys, the daylight report, the rounds of pre-application advice. One is building in Westminster and the other in Croydon. They have spent identical sums on identical work, but the potential payoff is significantly different.
In Westminster that £60,000 buys its way onto a scheme worth about £5.6 million in residual land value, the developer’s remaining value once development costs are covered, a rounding error of roughly 1%. In Croydon the residual is about £288,000, so the same £60,000 is a fifth of the upside. The cost is fixed, but what it buys is anything but. Across London the preparation bill runs from about 1% of the residual in Kensington and Chelsea and Westminster to 9% in Barking and Dagenham, 11% in Havering and 21% in Croydon, a twenty-fold range for what is, on paper, an identical set of drawings.
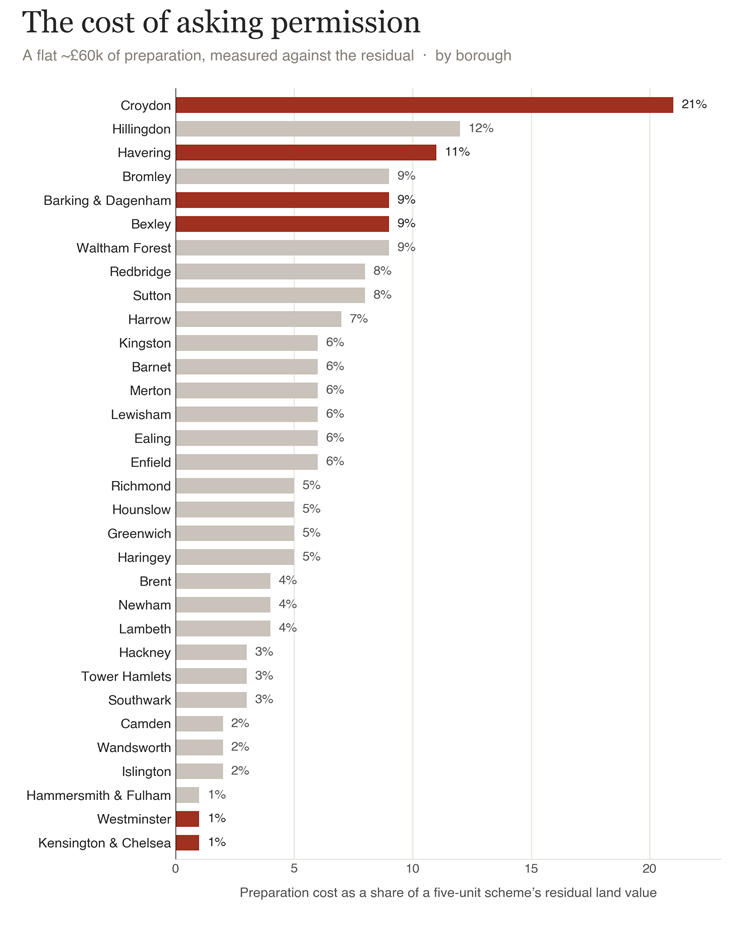
Planning preparation cost as a share of a five-unit scheme’s residual land value, by borough. Source: London Small Sites Planning Dataset; Land Registry.
The preparation bill is identical, but it consumes a very different share of the project’s value depending on where you build. Economists would recognise this as regressive pricing, and we usually catch it on sight. A £100 fine is a parking ticket to a banker and a fortnight’s anxiety to a student, so a flat charge is only flat on the form. The same number on the invoice does not mean the same economic burden. We rarely notice that the cost of asking permission to build works in the same way.
The burden is heaviest where it can least be carried. Design is the primary reason in 35.5% of London’s small-site refusals. Design is also the issue most dependent on judgement, the hardest to predict and one of the hardest to overturn on appeal. Yet good preparation, meaning better drawings, stronger evidence and more consultant time, is exactly what helps address design concerns. The applicants least able to afford that preparation are therefore those most exposed to refusals based on it. Put simply, wherever getting ready costs the most, the answer is most often no.
Boroughs all know that refusal numbers may be tactically softened. Applicants in expensive boroughs withdraw at roughly twice the rate of those in affordable ones, not because their schemes are worse but because their consultants read the officer’s mood and pull the application before a refusal is issued, because withdrawing preserves the option to revise and resubmit without carrying a refusal on the record. The applicant at the affordable end takes the refusal instead. The result is that the visible approval gap is the flattering version of the story, because the affordable end absorbs the rejections that the expensive end has the means to dodge.
The lesson is not to avoid affordable boroughs altogether, but to recognise that the preparation cost is part of the land price. Build it into your appraisal and your bid. Borough policy matters just as much as land value. Bexley illustrates this: despite relatively low land values, it recorded an outcome differential of +18.9 because its local plan clearly signals what it will approve.
Then there is the cost nobody measures, because it exposes policy rather than councils. Every new planning requirement usually arrives as a fixed cash cost. That fixed cost barely matters on a Westminster scheme, as mentioned earlier, but can remove a significant share of the profit on a Croydon one. Biodiversity net gain is the current example, stacked on top of drainage, fire, energy and an ever-growing evidence base, and as far as the public record shows none of it has been modelled as a share of the residual across the price range before adoption. We have built a biodiversity charge that protects habitats in SW1 partly by pricing families out of CR0 and called it neutral because the figure on the form is the same in both places.
The remedy is not to scrap the requirements but perhaps to do the maths first. Before introducing any new requirement, model what it represents as a percentage of the likely residual value in high-, medium- and low-cost boroughs. That is how you would test whether a supposedly neutral charge is, in practice, regressive. The data exists and the exercise needs to be run.
The sting is in the geography. The affordable end of London is where small sites to do the most work, where the housing need is greatest, and where a single converted house adds meaningfully to housing targets. Yet it is also where the cost of simply trying is highest against the reward. The result is that the system filters out precisely the developers least able to absorb those costs, with nobody having chosen that outcome, which is worse than if someone had. That is the regressive stack, and until somebody counts it the answer to “who is accountable” is no one, because no one is counting.
Abre Etteh is the founder of Perfect Scale and the author of the London Borough of Merton’s small-sites planning guidance. This essay is adapted from the white paper Given What You Received.
Preparation-burden figures are derived from the London Small Sites Planning Dataset (LSSPD) and 2024–25 Land Registry price-paid data; the ~£60,000 preparation estimate is held constant across boroughs and expressed as a share of the modelled five-unit residual. Full method and limitations are in the white paper, available from Perfect Scale.
Method note. The outcome differential is calculated by fitting a single London-wide statistical model to 11,689 small-site planning decisions from 2022 to 2026. The model predicts the probability of approval from site type, public transport accessibility (PTAL), conservation status and the number of homes proposed, but deliberately excludes the borough, which lets each borough’s difference from the London average be measured. The published score is the borough’s observed approval rate minus the expected approval rate the model gives for its own caseload.
Perfect Scale · perfect-scale.co.uk