
The Outcome Differential
Why the borough decides more than the architect does
First of three. A propviews series on London’s borough disparity in approving small housing schemes: the measure, its cost, and who bears it.
Ranking England’s secondary schools by their raw exam results tells you very little, because the school at the top is usually the selective grammar in the comfortable catchment and the school at the bottom is usually the comprehensive given the most difficult intake. So, the table is really measuring the pupils each school was handed rather than the job it did with them. School inspectors worked this out long ago and switched to a progress measure: not the grade a child finished on, but the distance they travelled to reach it. A school that takes children from far behind and moves them up the grading ladder now scores well, even where its raw results never trouble the top of the league.
London’s planning system has never had that second measure. We might rank boroughs by the share of applications they approve, but that produces a figure that flatters the borough handed easy cases and penalises the borough with difficult ones. It then becomes an easy thing to read the ranking as though it described how welcoming each borough is to new homes. But that approach doesn’t give us a true picture.
This led me to build the missing measure for small housing schemes: a progress score that is not apparent in the raw rate. The outcome differential measures whether a borough approves more or fewer applications than would be expected given the types of cases it receives.
Data crunching
Across 11,689 decisions on schemes of one to nine homes, taken in the 32 boroughs between 2022 and 2026, I asked the same question of every application: given the sort of site this is, what would the average London borough have been expected to do? To answer it, I built a single statistical model using all 11,689 decisions.
The model predicts the likelihood of approval using four characteristics that sit outside a borough’s control: the site type, its transport accessibility, whether it is in a conservation area and the number of homes proposed. It deliberately ignores which borough made the decision. That produces an expected approval probability for every application.
A borough’s outcome differential is the difference between what the model expected it to approve, given its mix of applications, and what it actually approved. Suppose the model predicts that a borough’s mix of applications would normally achieve a 60% approval rate across London. If that borough actually approves 75%, its outcome differential is +15 percentage points. If it approves only 40%, its differential is −20.
A score of zero means the borough approves exactly as often as the average London borough would be expected to approve the same mix of applications. A positive score means it approves more often than expected. A negative score means it approves less often than expected.
The results
Measured this way, with the difficulty of the caseload stripped out, the distance between the most permissive borough and the most restrictive comes to 43 percentage points, which makes the choice of borough the single largest influence on whether a small scheme gains permission, ahead of the architect, the design team and possibly even the size of the scheme.
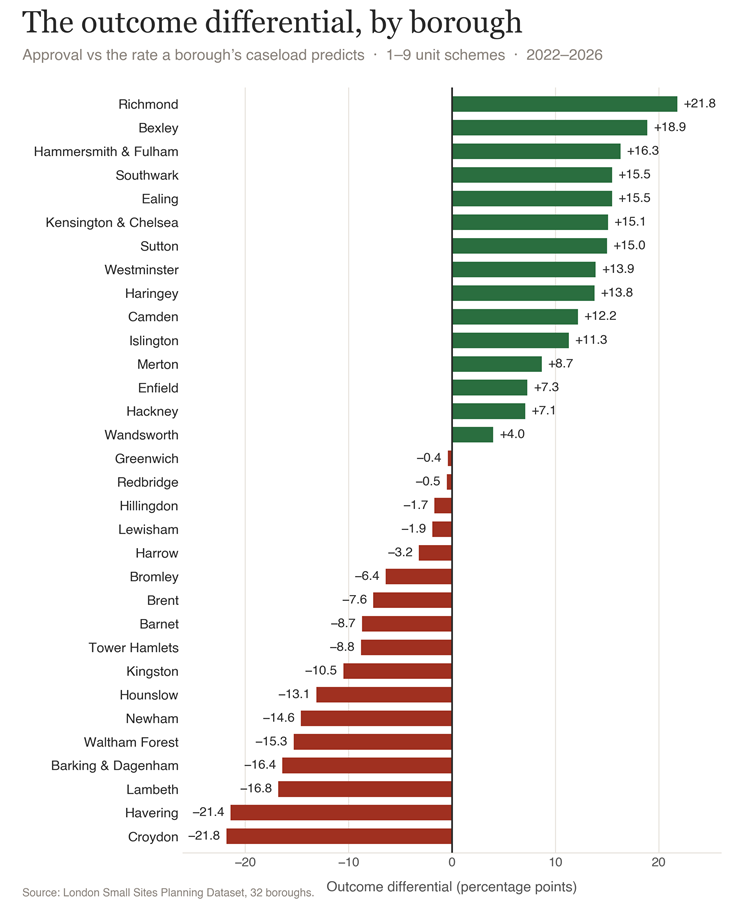
Outcome differential by borough, 2022–2026. A negative score means a borough approves less than its caseload predicts. Source: London Small Sites Planning Dataset.
These are not trivial schemes to get wrong. Small sites, from the converted house to the backland plot are meant to carry close to a quarter of London’s housing target. They are the natural home of the smaller builders whose share of output has fallen for four decades, so a small scheme refused is rarely a small loss. On raw approval rates the two ends of the table look a world apart: Kensington and Chelsea granted 80.8% of its small-site applications and Havering granted 29.5%, a gap of 51 points. Part of that is a genuine difference in caseload, because Havering does receive more conservation area proposals, more awkward plots and more backland on poor transport, and the differential exists precisely to remove those differences in the kinds of applications boroughs receive, so that what remains is the borough’s own tendency to approve or refuse similar schemes. What it cannot remove, and what is left once it has done its work, is a 43-point spread that turns out to track house prices.
The five most restrictive boroughs
| Borough | Raw approval | Differential | Median ward price |
| Croydon | 30.5% | −21.8 pp | £280k |
| Havering | 29.5% | −21.4 pp | £263k |
| Lambeth | 41.6% | −16.8 pp | £425k |
| Barking & Dagenham | 34.7% | −16.4 pp | £240k |
| Waltham Forest | 35.6% | −15.3 pp | £390k |
The five most permissive boroughs
| Borough | Raw approval | Differential | Median ward price |
| Richmond | 79.5% | +21.8 pp | £465k |
| Bexley | 71.1% | +18.9 pp | £260k |
| Hammersmith & Fulham | 75.5% | +16.3 pp | £599k |
| Ealing | 69.0% | +15.5 pp | £410k |
| Southwark | 71.7% | +15.5 pp | £450k |
Consider the workhorse of small-site supply, the conversion of a single house into flats. London approved these at around 55%, yet Havering approved just 27% of them while Bexley approved 66%, and that is the same building type assessed after the same adjustment for everything outside a borough’s control (site type, conservation area, PTAL, density), with forty points of difference between the two. For anyone choosing a house to divide, that gap is the line between a viable project and a write-off.
Two patterns come straight off the tables. The more restrictive boroughs are mostly the more affordable outer and eastern ones, with Lambeth the inner-London exception, while the more permissive are mostly the expensive inner ones, with Bexley the conspicuous exception arriving from the affordable end. Plot the differential against house prices and the line slopes the way one would hope it did not, so that the more affordable the borough the worse it tends to treat its own caseload. This is the reverse of what the city needs given that the affordable boroughs are exactly where affordable homes are most viable.
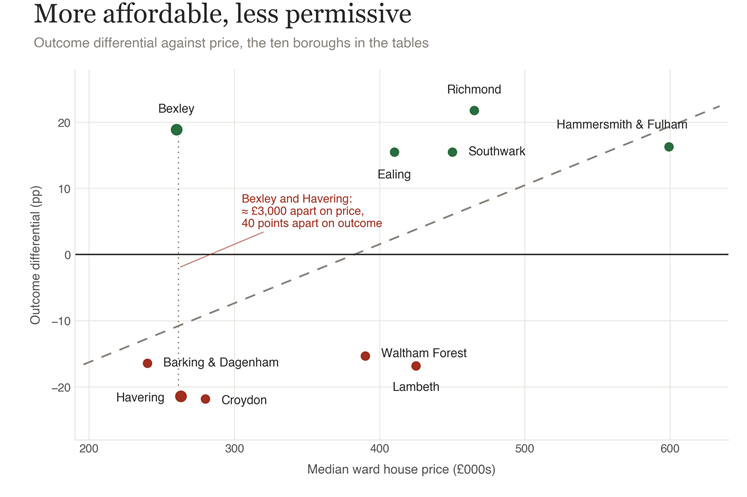
Outcome differential against median ward house price, for the boroughs named in this essay. Bexley and Havering sit about £3,000 apart on price and forty points apart on outcome.
This is not simply planning being planning. London already approves a smaller share of applications than England as a whole and has done for years, and then, within London, it turns the price relationship upside down. Nationally the slope runs the other way: County Durham, where the median home costs around £125,000, granted about 94% of all the planning applications it received, and much of the affordable north cleared 90% without strain. London is the one place where the more affordable a borough, the more restrictive it is inclined to be, which is an anomaly rather than the norm.
The clearest test sits in two boroughs barely three thousand pounds apart in price. Bexley and Havering have almost identical house prices, transport and demographics, yet Bexley ran at +18.9 while Havering ran at −21.4, the same price and forty points apart, so whatever produces that distance it is plainly not the cost of a house. Sutton and Enfield make the same point from the affordable end, both sitting comfortably above the average.
A borough’s position is not fixed, however. Croydon adopted a small-sites design code in 2019, then a new administration took office in 2022 promising to scrap it and did so that July. What resulted was the borough’s approval rate falling from the mid-fifties to the low thirties, a drop of around twenty points, while its neighbours held steady. Although the applicants were the same, the land was the same and the cost of preparing a scheme was the same; what changed was the instruction to officers on how to read a single word, ’character.’ Russell Curtis of RCKa, reading Croydon’s own monitoring, notes that the permissive years had in fact peaked in 2017, before the code existed, but either way the rate moved with the politics rather than anything material in submissions.
It is worth noticing what survives when a restrictive borough’s refusal is tested. One example is a refused backland scheme in Havering overturned at appeal. In his ruling the Inspector found that it had complied with the borough’s own policies throughout. One case proves nothing on its own, but it shows the shape of something to be avoided: a refusal inconsistent with local policies.
A word on what the number is, and is not. It is a residual rather than a verdict. The differential measures what is left after accounting for the four factors in the model. It cannot see the quality of a design, the skill of the consultant or the discussions that took place before an application was submitted. A large negative score might record a borough’s settled and openly stated policy applied with perfect consistency, or it might record the thinner applications that more affordable boroughs tend to attract. In truth it probably records some of each, which this dataset cannot pull apart without more information and interrogation. The differential will not tell you why a borough decides as it does. It tells you how it does.
The workings have been kept light here, because this essay adapts a single strand of a longer white paper, Given What You Received, which sets out the regression, the four controls and their limits, and the full borough-by-borough results in considerably more depth.
What we are seeing
What the number removes is the excuse. A 43-point spread, drawn from the boroughs’ own twelve thousand decisions after the four biggest drivers of caseload have been taken out, is too large to be noise and too steady to be luck, and it leaves the borough you build in as the foreground of the decision rather than its backdrop. That raises a question for every borough: given the cases you were handed, what did you produce, and where your answer sits twenty points below the borough next door, what exactly is that achieving?
For a good many boroughs the answer is housing that London was counting on and did not get, in the very places it is cheapest to build. A borough three thousand pounds cheaper than its neighbour and forty points lower in outcome is not bowing to the market; it is deciding, one application at a time, to turn down a potentially viable home. Spread that across the quarter of London’s housing target that small sites are meant to carry, and the differential stops being a statistic and becomes the policy. Whether that is a defensible choice or an unexamined habit, and who pays for a negative answer, are the questions the next two essays take up.
Abre Etteh is the founder of Perfect Scale and the author of the London Borough of Merton’s small-sites planning guidance. This essay is adapted from the white paper Given What You Received.
Built from the London Small Sites Planning Dataset: 11,689 decided applications for one- to nine-home residential schemes across the 32 boroughs, 2022 to 2026. Full method and limitations are in the white paper, available from Perfect Scale.
Method note. The outcome differential is calculated by fitting a single London-wide statistical model to 11,689 small-site planning decisions from 2022 to 2026. The model predicts the probability of approval from site type, public transport accessibility (PTAL), conservation status and the number of homes proposed, but deliberately excludes which borough determined the application, allowing each borough’s tendency to approve or refuse applications to be measured against the London average. The published score is the borough’s observed approval rate minus the expected approval rate the model gives for its own caseload.
Perfect Scale · perfect-scale.co.uk